
Statistics

Total enrolled in Graduation and Post-Graduation
Academic year: 2019/2020
Total Enrolled in Post-Graduation
Total Enrolled in Graduation
Educational spaces
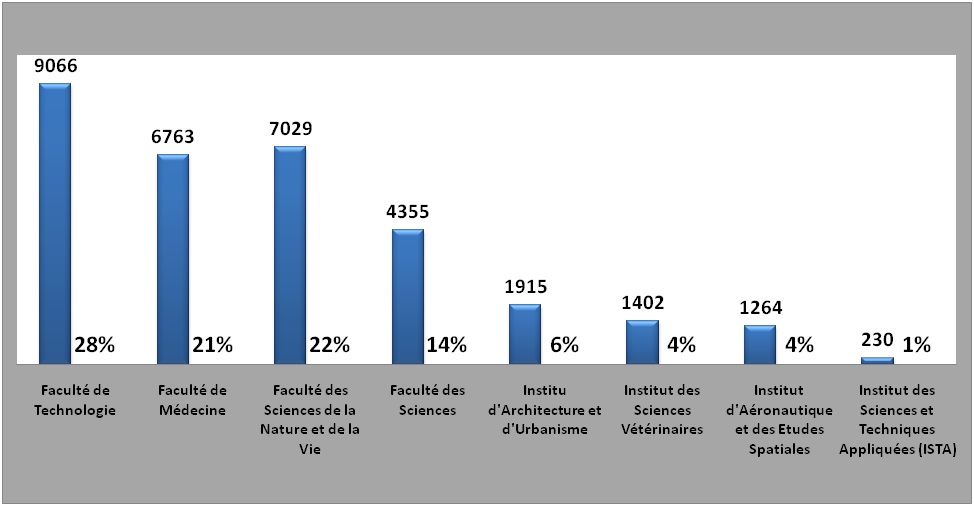
Total enrolled in Graduation by faculty and institute in number and percentage
Academic year: 2019/2020

Faculty of Technology 28%
Faculty of Natural and Life Sciences 22%
Faculty of Medicine 21%
Faculty of Sciences 14%
Institute of Architecture and Urban Planning 6%
Institute of Veterinary Sciences 4%
Institute of Aeronautics and Space Studies 4%
Institute of Applied Technical Sciences 1%

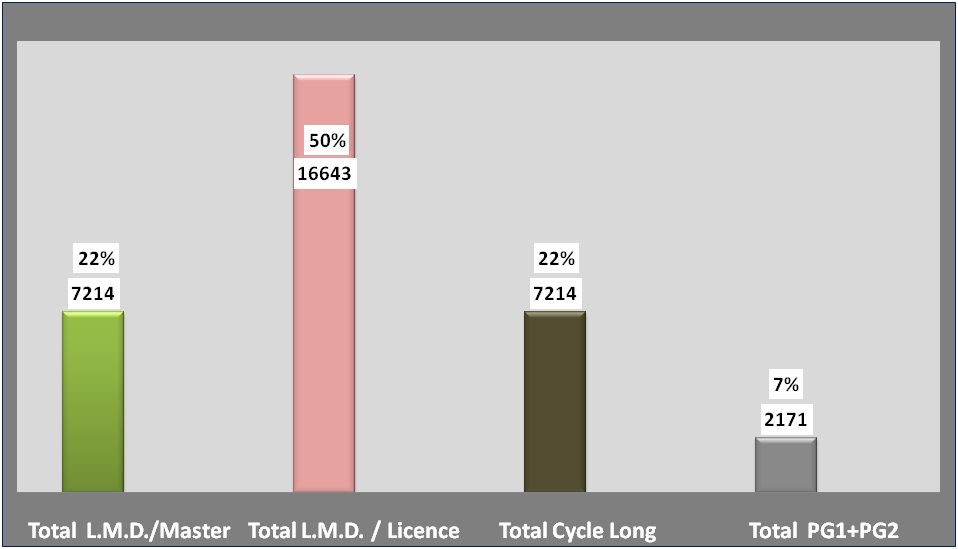
Total enrolled in Graduation and Post-Graduation BY CYCLE AND SYSTEM
Academic year: 2019/2020
Total LMD/License 50%
Total LMD/Master 22%
Total Long Cycle 22%
Total PG1+PG2 7%
Number of Post-Graduation Enrollees and Graduates
Academic year: 2019/2020

Master (PG1)
Magister Doctoral School (PG1)
DEMS (PG1)
Registered
Graduates
Doctor of Science (PG2)
LMD doctorate (PG12)
DSM (PG12)
Registered
Graduates

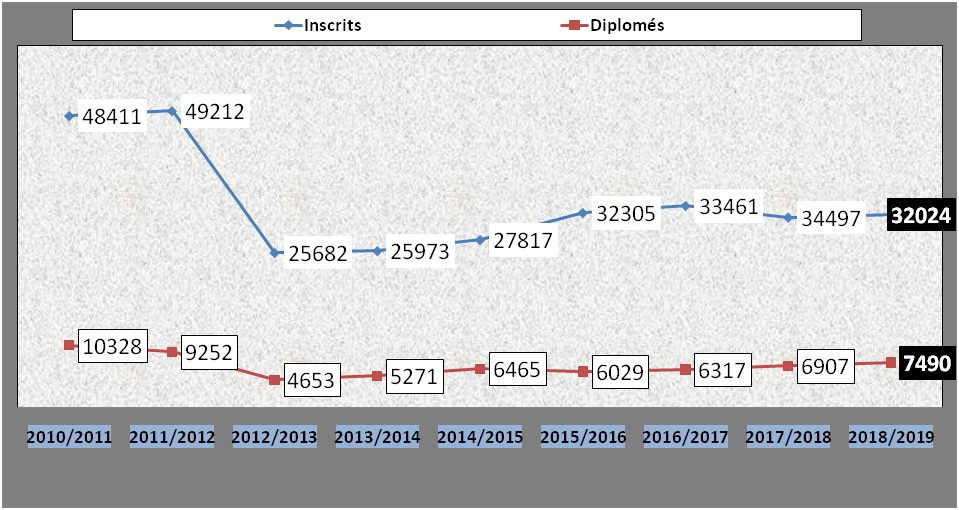
Number of Registrants and Graduation Graduates per Year
University years: 2010/2011 to 2019/2020
2017/2018
2018/2019
2019/2020
Registered
Graduates
Number of permanent teachers by grade
Academic year: 2019/2020

Professor
Senior lecturer
Assistant Master
Assistant
Teacher Trainer

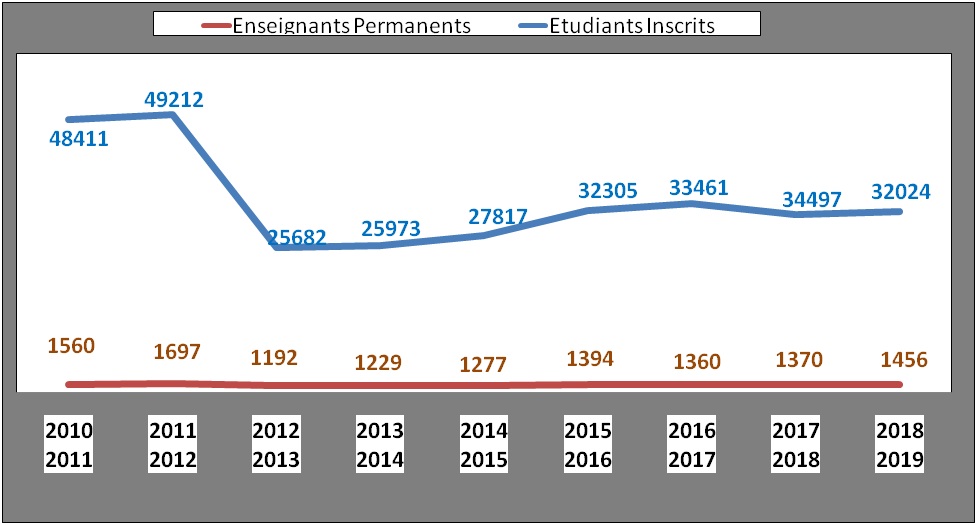
Evaluation of the number of students enrolled in Graduation compared to the permanent teaching staff per year
University years: 2010/2011 to 2019/2020
2017/2018
2018/2019
2019/2020
Registered
Permanent

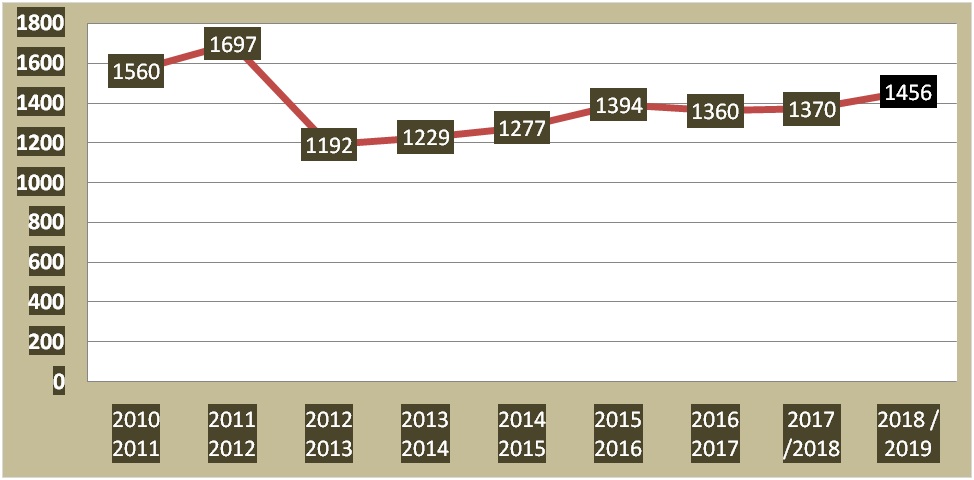
Evolution of the number of permanent teachers per year
University years: 2010/2011 to 2019/2020